
TL;DR: 3D maps make it easier to understand turns and exits, but streaming and rendering them is resource-intensive on phones and in vehicles. ES3D represents buildings and roads as SVG-style shapes and generates triangles directly on the device. In driving tests across four cities against MapLibre GL JS and CesiumJS, ES3D’s data sizes were comparable to vector tiles while maintaining full 3D geometry, at the cost of a slower first view.
Disclosure: I created ES3D, the format discussed in this article. I tried to remain objective, but keep that in mind.
Why 3D maps?
Why is a 3D map needed at all? Take a look at this post on X (formerly Twitter) by @TheAppleDesign.
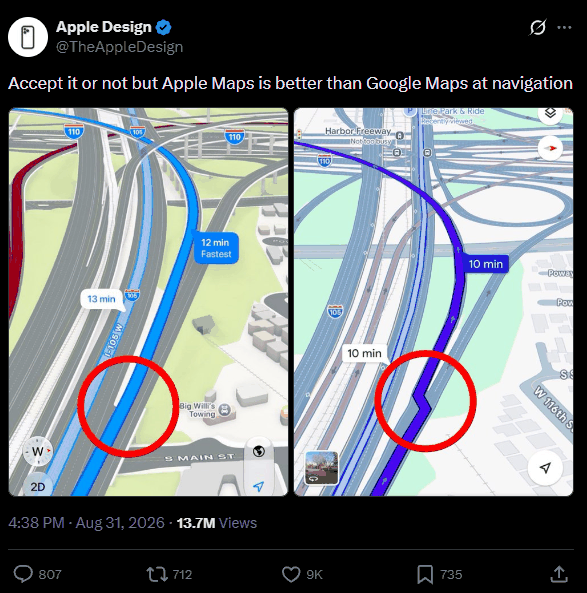
Regardless of whether the post is accurate or not, the 3D display makes it much easier to see which exit to take and which roads you will pass. It’s difficult to assess these details on a 2D map, which leads to confusion and wasted time.
Why is 3D so rarely integrated?
There are several reasons. Creating 3D maps requires a lot of time and effort, the appropriate software doesn’t exist yet and roads keep changing, so it’s difficult to keep them up to date.
There is another simple reason. Streaming 3D data requires more resources than streaming 2D data, and transmitting it to millions of people increases the load on servers and bandwidth usage, which is hard to justify for most companies.
Additionally, 3D maps need to work on users’ phones. Mobile connections are often weak, so it may be necessary to download the entire area in advance. As the vehicle moves, the images need to be updated continuously, which reduces battery life, including during periods when the vehicle is stationary at a traffic light.
To be fair, 3D navigation does indeed exist. Apple Maps shows detailed 3D views of cities, while Google Maps offers an Immersive View mode for displaying routes. However, both of these tools only work in specific cities and rely on heavy, pre-built 3D data, which is exactly the problem mentioned above.
Two existing solutions
Vector tiles contain 2D geometry and attributes. This results in a compact structure whose visual appearance can be easily changed, but in practice it’s merely 2.5D: each shape is a vertical prism with a flat top.
Mesh formats such as glTF (and the 3D Tiles standard based on it) have their own drawbacks. Each wall and roof is represented as vertices, normals and indices, with each level of detail being a separate mesh. Compression methods like meshoptimizer or Draco reduce data volume, but the number of triangles is fixed in advance. This means that someone using a large display in a car and someone using a small phone must process the same number of triangles.
A third approach: describe shapes rather than triangles
The third approach has been used in 2D for a very long time. SVG describes graphics as paths and shapes, leaving the actual rendering to the viewer. The same file looks sharp on any screen.
Procedural modelling and semantic city models such as CityGML apply the same concept to buildings: they describe them based on the level of detail (LOD), which is determined by what the building actually contains, rather than the number of triangles. ES3D attempts to apply the SVG approach to the 3D web.
In this article, I will examine what advantages and disadvantages such a format brings to navigation software.
What ES3D does
An ES3D document is text in XML format, and its shapes are SVG-style elements. To further reduce file size, repeats and other techniques in the format can be used for recurring elements, such as similar row homes. A building in a city tile might look something like this:
<es3d version="1" unit="m">
  <material id="mid-rise" color="#9db1d8"/>
  <!-- rotate the flat footprint so the extrusion stands upright -->
  <group rot="-90,0,0">
    <extrude d="M0 0 L24 0 L24 18 L0 18 Z" depth="45" m="mid-rise"/>
  </group>
</es3d>
The viewer receives this data and converts it into meshes on the device using WebGPU or WebGL2. For navigation, five features are the most important:
- Generated detail. Each curved shape has multiple levels of tessellation. The renderer selects a specific level in such a way that the geometric error remains within acceptable limits, so smartphones and desktop computers use the same meshes for the same view. Shapes that differ only in size share one mesh.
- Fragments. Multiple documents can exist on a single stage at the same time. Each one can be added, replaced, hidden or removed individually, while sharing materials and generated meshes.
- Compilation in a separate thread and a frame budget. A fragment can be compiled in a worker, and applying changes is limited by a per-frame budget (4 ms by default).
- Addressable elements. Any element with an identifier can be moved by setting its transform, without the need to recompile the scene.
- Drawing only on change. A frame is drawn only when something visible has changed.
To test my proposal, I built a benchmark in which the same scene is rendered using ES3D 1.2.1, MapLibre GL JS 6.18.0 and CesiumJS 1.147.0, with the same route, camera and clock in four cities (Manhattan, downtown Toronto, San Francisco and the City of London). Each engine streams the same OpenStreetMap content in its own format: ES3D documents, Mapbox Vector Tiles, and glTF tiles. The vehicle follows simulated GPS data with realistic errors, stops at a red light and misses a turn, forcing a reroute. The results below were obtained from one full drive through each city on a desktop PC with an NVIDIA RTX 50-series GPU (the lower the score, the better):
| Measurement (range across four cities) | ES3D | MapLibre GL JS | CesiumJS |
|---|---|---|---|
| Size of the library (compressed using Brotli) | 115 KB | 373 KB | 919 KB |
| Map data for the first view | 50–117 KB | 48–114 KB | 310–622 KB |
| Map data for the entire drive | 479–761 KB | 488–840 KB | 2.89–4.84 MB |
| Main-thread time per frame | 0.5–1.0 ms | 2.5–2.8 ms | 0.8–1.2 ms |
| Time until the city appears on screen | 0.35–0.95 s | 0.17–0.19 s | 0.68–0.85 s |
| Time to draw a new route | 6–22 ms | 11–17 ms | 17–31 ms |
These tests are by no means perfect, and I invite someone else to try reproducing them. They still show one thing: ES3D is a viable alternative. Its data sizes are comparable to vector tiles and several times smaller than glTF tiles, while still describing full 3D geometry. The downside is a slower first view compared to MapLibre. Additionally, all my tests were conducted on a desktop computer with a discrete graphics card. I haven’t yet tested phones or in-car hardware. I assume the differences there will be even more noticeable, but that’s just a hypothesis.
Conclusion
Navigation rendering requires an unusual combination of qualities: the compactness of vector tiles, the expressiveness of meshes where roads leave the ground, strict control over main-thread time, and no work while idle. A format that describes shapes and generates triangles directly on the device meets all these requirements by its very design. In my analysis, ES3D is capable of handling this task.
If you work on navigation or 3D web rendering, I would appreciate your feedback.
Disclosure: I am the author of ES3D, the format discussed in this article.